Luxembourg (Chamber of Representatives constituency)
| Luxembourg | |
|---|---|
| Luxemburg | |
| Constituency for the Chamber of Representatives | |
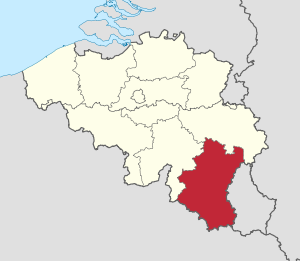 Location of Luxembourg within Belgium | |
| Province | Luxembourg |
| Region | Wallonia |
| Population | 293,967 (2023)[1] |
| Electorate | 212,441 (2019) |
| Area | 4,459 km2 (2023)[2] |
| Current Constituency | |
| Created | 1995 |
| Seats | List
|
| Members[3] | List |
| Created from | |
Luxembourg (Dutch: Luxemburg) is one of the 11 multi-member constituencies of the Chamber of Representatives, the lower house of the Belgian Federal Parliament, the national legislature of Belgium. The constituency was established as Arlon-Marche-Bastogne-Neufchâteau-Virton (Dutch: Aarlen-Marche-Bastenaken-Neufchâteau-Virton) in 1995 following the fourth Belgian state reform. It was renamed Luxembourg in 2003 following the re-organisation of constituencies across Belgium along provincial lines. It is conterminous with the province of Luxembourg. The constituency currently elects four of the 150 members of the Chamber of Representatives using the open party-list proportional representation electoral system. At the 2019 federal election the constituency had 212,441 registered electors.
Electoral system[edit]
Luxembourg currently elects four of the 150 members of the Chamber of Representatives using the open party-list proportional representation electoral system.[4][5] Seats are allocated using the D'Hondt method.[6][7] Since 2003 only parties that reach the 5% threshold in the constituency compete for seats.[8][9]
Electors may vote for the list (party) or for individual candidates, either main candidates or substitute candidates or a combination, on the list.[10] They may vote for as many candidates as there are seats in the constituency.[11] Split-ticket voting (panachage) is not permitted and will result in the ballot paper being invalidated.[12] The minimum number of votes a candidate must obtain to get elected - the quotient - is calculated as the total votes received by the party divided by the number of seats in the constituency plus one.[13] Half the ballot papers where there are no votes for main candidates (i.e. the elector has voted for the list or for substitute candidates only) are redistributed amongst main candidates in the order they appear on the ballot paper so that the candidate's total votes (personal votes plus redistributed votes) equals the quotient.[13] The seats won by the party are then allocated to the candidates with the most number of total votes.[13]
Election results[edit]
Summary[edit]
| Election | Workers PTB |
Ecolo Ecolo |
Socialists PS |
Democratic Federalists DéFI / FDF |
Reformists MR / PRL-FDF |
Les Engagés LE / CDH / PSC |
Chez Nous Chez Nous / PP |
National Front FN | ||||||||||||||||
|---|---|---|---|---|---|---|---|---|---|---|---|---|---|---|---|---|---|---|---|---|---|---|---|---|
| Votes | % | Seats | Votes | % | Seats | Votes | % | Seats | Votes | % | Seats | Votes | % | Seats | Votes | % | Seats | Votes | % | Seats | Votes | % | Seats | |
| 2019 | 15,424 | 9.03% | 0 | 27,338 | 16.00% | 1 | 31,898 | 18.67% | 1 | 5,092 | 2.98% | 0 | 40,242 | 23.56% | 1 | 40,056 | 23.45% | 1 | 4,933 | 2.89% | 0 | |||
| 2014 | 4,003 | 2.36% | 0 | 13,471 | 7.94% | 0 | 37,371 | 22.02% | 1 | 2,811 | 1.66% | 0 | 41,346 | 24.36% | 1 | 56,702 | 33.41% | 2 | 6,980 | 4.11% | 0 | |||
| 2010 | 1,194 | 0.74% | 0 | 18,853 | 11.71% | 0 | 45,869 | 28.49% | 1 | 31,459 | 19.54% | 1 | 50,564 | 31.41% | 2 | 3,922 | 2.44% | 0 | ||||||
| 2007 | 19,329 | 11.63% | 0 | 35,351 | 21.27% | 1 | 50,537 | 30.41% | 2 | 49,141 | 29.57% | 1 | 6,128 | 3.69% | 0 | |||||||||
| 2003 | 11,257 | 7.11% | 0 | 41,585 | 26.25% | 1 | 48,121 | 30.38% | 2 | 43,860 | 27.69% | 1 | 5,690 | 3.59% | 0 | |||||||||
| 1999 | 234 | 0.16% | 0 | 25,003 | 17.24% | 0 | 28,989 | 19.99% | 1 | 40,857 | 28.17% | 1 | 41,301 | 28.48% | 1 | 3,496 | 2.41% | 0 | ||||||
| 1995 | 511 | 0.36% | 0 | 13,059 | 9.28% | 0 | 33,870 | 24.07% | 1 | 40,915 | 29.08% | 1 | 45,396 | 32.26% | 1 | 5,780 | 4.11% | 0 | ||||||
(Figures in italics represent alliances.)
Detailed[edit]
2010s[edit]
2019[edit]
Results of the 2019 federal election held on 26 May 2019:[14][15][16]
| Party | Votes per arrondissement | Total Votes |
% | Seats | |||||||
|---|---|---|---|---|---|---|---|---|---|---|---|
| Arlon | Bast- ogne |
Marche -en- Famenne |
Neuf- château |
Virton | Expat- riates | ||||||
| Reformist Movement | MR | 7,175 | 6,462 | 7,933 | 11,605 | 6,934 | 133 | 40,242 | 23.56% | 1 | |
| Humanist Democratic Centre | CDH | 9,201 | 9,358 | 7,739 | 7,504 | 6,202 | 52 | 40,056 | 23.45% | 1 | |
| Socialist Party | PS | 5,788 | 3,651 | 7,706 | 7,244 | 7,463 | 46 | 31,898 | 18.67% | 1 | |
| Ecolo | Ecolo | 7,925 | 4,058 | 4,622 | 4,766 | 5,816 | 151 | 27,338 | 16.00% | 1 | |
| Workers' Party of Belgium | PTB | 2,423 | 2,460 | 3,795 | 3,885 | 2,845 | 16 | 15,424 | 9.03% | 0 | |
| DéFI | DéFI | 1,093 | 684 | 1,229 | 1,147 | 920 | 19 | 5,092 | 2.98% | 0 | |
| People's Party | PP | 1,118 | 855 | 1,119 | 1,019 | 805 | 17 | 4,933 | 2.89% | 0 | |
| Destexhe List | 293 | 491 | 365 | 322 | 232 | 4 | 1,707 | 1.00% | 0 | ||
| Vlaams Belang | VB | 359 | 281 | 383 | 277 | 213 | 4 | 1,517 | 0.89% | 0 | |
| The Right | 404 | 219 | 300 | 265 | 248 | 4 | 1,440 | 0.84% | 0 | ||
| Nation | 276 | 204 | 236 | 273 | 185 | 2 | 1,176 | 0.69% | 0 | ||
| Valid Votes | 36,055 | 28,723 | 35,427 | 38,307 | 31,863 | 448 | 170,823 | 100.00% | 4 | ||
| Rejected Votes | 3,934 | 3,107 | 3,253 | 3,971 | 3,563 | 30 | 17,858 | 9.46% | |||
| Total Polled | 39,989 | 31,830 | 38,680 | 42,278 | 35,426 | 478 | 188,681 | 88.82% | |||
| Registered Electors | 46,043 | 35,586 | 43,372 | 47,116 | 39,666 | 658 | 212,441 | ||||
| Turnout | 86.85% | 89.45% | 89.18% | 89.73% | 89.31% | 72.64% | 88.82% | ||||
The following candidates were elected:[16] Josy Arens (CDH), 17,308 votes; Mélissa Hanus (PS), 12,183 votes; Benoît Piedboeuf (MR), 14,052 votes; and Cécile Thibaut (Ecolo), 6,502 votes.
Substitutions:[17]
- Cécile Thibaut (Ecolo) resigned on 23 September 2021 and was substituted by Olivier Vajda (Ecolo) on the same day.
2014[edit]
Results of the 2014 federal election held on 25 May 2014:[18][19][20]
| Party | Votes per arrondissement | Total Votes |
% | Seats | |||||||
|---|---|---|---|---|---|---|---|---|---|---|---|
| Arlon | Bast- ogne |
Marche -en- Famenne |
Neuf- château |
Virton | Expat- riates | ||||||
| Humanist Democratic Centre | CDH | 10,343 | 12,568 | 11,854 | 12,509 | 9,346 | 82 | 56,702 | 33.41% | 2 | |
| Reformist Movement | MR | 8,120 | 6,986 | 8,025 | 10,519 | 7,596 | 100 | 41,346 | 24.36% | 1 | |
| Socialist Party | PS | 7,934 | 4,049 | 8,069 | 8,784 | 8,464 | 71 | 37,371 | 22.02% | 1 | |
| Ecolo | Ecolo | 3,905 | 1,901 | 2,449 | 2,364 | 2,807 | 45 | 13,471 | 7.94% | 0 | |
| People's Party | PP | 1,417 | 1,189 | 1,623 | 1,455 | 1,288 | 8 | 6,980 | 4.11% | 0 | |
| Workers' Party of Belgium | PTB | 752 | 675 | 1,167 | 743 | 661 | 5 | 4,003 | 2.36% | 0 | |
| Debout Les Belges! | 794 | 389 | 564 | 622 | 583 | 6 | 2,958 | 1.74% | 0 | ||
| Francophone Democratic Federalists | FDF | 711 | 377 | 580 | 641 | 498 | 4 | 2,811 | 1.66% | 0 | |
| The Right | 566 | 314 | 387 | 417 | 324 | 4 | 2,012 | 1.19% | 0 | ||
| Belgische Unie – Union Belge | BUB | 225 | 83 | 158 | 153 | 127 | 6 | 752 | 0.44% | 0 | |
| Left Movement | MG | 328 | 54 | 65 | 63 | 155 | 1 | 666 | 0.39% | 0 | |
| Rassemblement Wallonie France | RWF | 151 | 98 | 168 | 106 | 120 | 2 | 645 | 0.38% | 0 | |
| Valid Votes | 35,246 | 28,683 | 35,109 | 38,376 | 31,969 | 334 | 169,717 | 100.00% | 4 | ||
| Rejected Votes | 3,328 | 2,218 | 2,607 | 3,207 | 3,019 | 37 | 14,416 | 7.83% | |||
| Total Polled | 38,574 | 30,901 | 37,716 | 41,583 | 34,988 | 371 | 184,133 | 89.83% | |||
| Registered Electors | 44,299 | 33,889 | 41,787 | 45,813 | 38,716 | 484 | 204,988 | ||||
| Turnout | 87.08% | 91.18% | 90.26% | 90.77% | 90.37% | 76.65% | 89.83% | ||||
The following candidates were elected:[20] Benoît Lutgen (CDH), 36,340 votes; Benoît Piedboeuf (MR), 15,351 votes; Sébastian Pirlot (PS), 13,815 votes; and Isabelle Poncelet (CDH), 12,954 votes.
2010[edit]
Results of the 2010 federal election held on 13 June 2010:[21][22][23]
| Party | Votes per arrondissement | Total Votes |
% | Seats | |||||||
|---|---|---|---|---|---|---|---|---|---|---|---|
| Arlon | Bast- ogne |
Marche -en- Famenne |
Neuf- château |
Virton | Expat- riates | ||||||
| Humanist Democratic Centre | CDH | 9,701 | 11,097 | 9,802 | 11,102 | 8,802 | 60 | 50,564 | 31.41% | 2 | |
| Socialist Party | PS | 8,907 | 5,270 | 11,620 | 10,752 | 9,302 | 18 | 45,869 | 28.49% | 1 | |
| Reformist Movement | MR | 5,108 | 6,455 | 6,078 | 8,490 | 5,272 | 56 | 31,459 | 19.54% | 1 | |
| Ecolo | Ecolo | 4,628 | 2,613 | 3,463 | 3,959 | 4,122 | 68 | 18,853 | 11.71% | 0 | |
| People's Party | PP | 837 | 573 | 804 | 1,073 | 633 | 2 | 3,922 | 2.44% | 0 | |
| Wallonia First | 722 | 415 | 654 | 514 | 616 | 8 | 2,929 | 1.82% | 0 | ||
| Belgische Unie – Union Belge | BUB | 710 | 338 | 435 | 601 | 524 | 10 | 2,618 | 1.63% | 0 | |
| Rassemblement Wallonie France | RWF | 357 | 323 | 590 | 406 | 570 | 3 | 2,249 | 1.40% | 0 | |
| Left Front | 245 | 227 | 254 | 253 | 227 | 0 | 1,206 | 0.75% | 0 | ||
| Workers' Party of Belgium | PTB | 247 | 197 | 326 | 218 | 206 | 0 | 1,194 | 0.74% | 0 | |
| Socialist Movement Plus | MS+ | 32 | 23 | 24 | 34 | 21 | 1 | 135 | 0.08% | 0 | |
| Valid Votes | 31,494 | 27,531 | 34,050 | 37,402 | 30,295 | 226 | 160,998 | 100.00% | 4 | ||
| Rejected Votes | 3,314 | 2,460 | 2,321 | 3,232 | 3,166 | 19 | 14,512 | 8.27% | |||
| Total Polled | 34,808 | 29,991 | 36,371 | 40,634 | 33,461 | 245 | 175,510 | 90.24% | |||
| Registered Electors | 39,242 | 32,739 | 40,524 | 44,536 | 37,177 | 264 | 194,482 | ||||
| Turnout | 88.70% | 91.61% | 89.75% | 91.24% | 90.00% | 92.80% | 90.24% | ||||
The following candidates were elected:[23] Philippe Collard (MR), 12,124 votes; Philippe Courard (PS), 22,899 votes; Benoît Lutgen (CDH), 33,038 votes; and Isabelle Poncelet (CDH), 11,466 votes.
Substitutions:[24]
- Isabelle Poncelet (CDH) resigned on 14 June 2010 and was substituted by Josy Arens (CDH) on 6 July 2010.
- Philippe Courard (PS) was appointed to the federal government and was substituted by André Perpète (PS) on 7 December 2011.
2000s[edit]
2007[edit]
Results of the 2007 federal election held on 10 June 2007:[25][26]
| Party | Votes per arrondissement | Total Votes |
% | Seats | |||||||
|---|---|---|---|---|---|---|---|---|---|---|---|
| Arlon | Bast- ogne |
Marche -en- Famenne |
Neuf- château |
Virton | Expat- riates | ||||||
| Reformist Movement | MR | 8,482 | 10,179 | 10,150 | 13,014 | 8,572 | 140 | 50,537 | 30.41% | 2 | |
| Humanist Democratic Centre | CDH | 11,714 | 9,426 | 9,085 | 9,964 | 8,888 | 64 | 49,141 | 29.57% | 1 | |
| Socialist Party | PS | 7,166 | 3,778 | 8,524 | 8,018 | 7,790 | 75 | 35,351 | 21.27% | 1 | |
| Ecolo | Ecolo | 4,737 | 2,582 | 3,930 | 4,131 | 3,852 | 97 | 19,329 | 11.63% | 0 | |
| National Front | FN | 1,448 | 880 | 1,416 | 1,355 | 1,019 | 10 | 6,128 | 3.69% | 0 | |
| Rassemblement Wallonie France | RWF | 412 | 248 | 298 | 366 | 682 | 5 | 2,011 | 1.21% | 0 | |
| New Belgian Front | FNB | 365 | 214 | 270 | 275 | 222 | 2 | 1,348 | 0.81% | 0 | |
| Communist Party of Wallonia | PC | 295 | 149 | 250 | 268 | 237 | 6 | 1,205 | 0.73% | 0 | |
| Federal Christian Democrats | CDF | 184 | 111 | 159 | 241 | 114 | 3 | 812 | 0.49% | 0 | |
| Union for a Popular Movement – Belgium | UMP-B | 86 | 33 | 72 | 55 | 52 | 4 | 302 | 0.18% | 0 | |
| Valid Votes | 34,889 | 27,600 | 34,154 | 37,687 | 31,428 | 406 | 166,164 | 100.00% | 4 | ||
| Rejected Votes | 3,291 | 2,084 | 2,423 | 2,845 | 2,782 | 37 | 13,462 | 7.49% | |||
| Total Polled | 38,180 | 29,684 | 36,577 | 40,532 | 34,210 | 443 | 179,626 | 92.17% | |||
| Registered Electors | 42,520 | 31,773 | 39,571 | 43,472 | 37,040 | 509 | 194,885 | ||||
| Turnout | 89.79% | 93.43% | 92.43% | 93.24% | 92.36% | 87.03% | 92.17% | ||||
The following candidates were elected:[26] Josy Arens (CDH), 23,511 votes; Philippe Collard (MR), 20,558 votes; Carine Lecomte (MR), 7,877 votes; and André Perpète (PS), 10,452 votes.
2003[edit]
Results of the 2003 federal election held on 18 May 2003:[27][28]
| Party | Votes per arrondissement | Total Votes |
% | Seats | |||||||
|---|---|---|---|---|---|---|---|---|---|---|---|
| Arlon | Bast- ogne |
Marche -en- Famenne |
Neuf- château |
Virton | Expat- riates | ||||||
| Reformist Movement | MR | 8,232 | 10,070 | 9,286 | 12,056 | 8,344 | 133 | 48,121 | 30.38% | 2 | |
| Humanist Democratic Centre | CDH | 9,852 | 7,676 | 9,969 | 8,557 | 7,740 | 66 | 43,860 | 27.69% | 1 | |
| Socialist Party | PS | 9,621 | 5,283 | 8,451 | 9,843 | 8,315 | 72 | 41,585 | 26.25% | 1 | |
| Ecolo | Ecolo | 3,171 | 1,373 | 2,211 | 2,096 | 2,333 | 73 | 11,257 | 7.11% | 0 | |
| National Front | FN | 1,381 | 847 | 1,187 | 1,279 | 989 | 7 | 5,690 | 3.59% | 0 | |
| Federal Christian Democrats | CDF | 600 | 464 | 559 | 1,115 | 694 | 17 | 3,449 | 2.18% | 0 | |
| Rassemblement Wallonie France | RWF | 340 | 203 | 228 | 279 | 878 | 6 | 1,934 | 1.22% | 0 | |
| Vivant | Vivant | 366 | 228 | 356 | 312 | 256 | 5 | 1,523 | 0.96% | 0 | |
| Socialist Movement | MS | 84 | 53 | 85 | 185 | 198 | 1 | 606 | 0.38% | 0 | |
| Revolutionary Progressive Party | PPR | 105 | 35 | 62 | 85 | 85 | 4 | 376 | 0.24% | 0 | |
| Valid Votes | 33,752 | 26,232 | 32,394 | 35,807 | 29,832 | 384 | 158,401 | 100.00% | 4 | ||
| Rejected Votes | 3,756 | 2,338 | 2,699 | 3,169 | 3,236 | 37 | 15,235 | 8.77% | |||
| Total Polled | 37,508 | 28,570 | 35,093 | 38,976 | 33,068 | 421 | 173,636 | 92.21% | |||
| Registered Electors | 41,780 | 30,509 | 37,891 | 41,826 | 35,796 | 505 | 188,307 | ||||
| Turnout | 89.78% | 93.64% | 92.62% | 93.19% | 92.38% | 83.37% | 92.21% | ||||
The following candidates were elected:[29] Josy Arens (CDH), 20,369 votes; Philippe Collard (MR), 17,847 votes; André Perpète (PS), 13,967 votes; and Dominique Tilmans (MR), 10,772.
1990s[edit]
1999[edit]
Results of the 1999 federal election held on 13 June 1999:[30][31]
| Party | Votes per arrondissement | Total Votes |
% | Seats | ||||||
|---|---|---|---|---|---|---|---|---|---|---|
| Arlon | Bast- ogne |
Marche -en- Famenne |
Neuf- château |
Virton | ||||||
| Christian Social Party | PSC | 6,905 | 7,612 | 9,070 | 10,556 | 7,158 | 41,301 | 28.48% | 1 | |
| Liberal Reformist Party and Democratic Front of Francophones |
PRL-FDF | 6,332 | 9,007 | 8,775 | 10,006 | 6,737 | 40,857 | 28.17% | 1 | |
| Socialist Party | PS | 6,850 | 3,308 | 5,674 | 7,367 | 5,790 | 28,989 | 19.99% | 1 | |
| Ecolo | Ecolo | 6,554 | 3,174 | 4,951 | 4,607 | 5,717 | 25,003 | 17.24% | 0 | |
| National Front | FN | 822 | 506 | 799 | 690 | 679 | 3,496 | 2.41% | 0 | |
| Vivant | Vivant | 538 | 375 | 566 | 494 | 475 | 2,448 | 1.69% | 0 | |
| French People United in a National Action of Co-operation and Emancipation |
FRANCE | 93 | 59 | 100 | 133 | 425 | 810 | 0.56% | 0 | |
| Communist Party of Wallonia | PC | 136 | 92 | 138 | 125 | 166 | 657 | 0.45% | 0 | |
| Party for a New Politics in Belgium | PNPB | 154 | 47 | 63 | 193 | 91 | 548 | 0.38% | 0 | |
| New Belgian Front | FNB | 44 | 80 | 116 | 63 | 58 | 361 | 0.25% | 0 | |
| Workers' Party of Belgium | PTB | 50 | 39 | 72 | 37 | 36 | 234 | 0.16% | 0 | |
| Democratic Union | UDDU | 137 | 12 | 16 | 32 | 36 | 233 | 0.16% | 0 | |
| Paradise Action Party | PAP | 18 | 11 | 27 | 31 | 18 | 105 | 0.07% | 0 | |
| Valid Votes | 28,633 | 24,322 | 30,367 | 34,334 | 27,386 | 145,042 | 100.00% | 3 | ||
| Rejected Votes | 3,651 | 2,910 | 3,159 | 3,660 | 4,349 | 17,729 | 10.89% | |||
| Total Polled | 32,284 | 27,232 | 33,526 | 37,994 | 31,735 | 162,771 | 92.18% | |||
| Registered Electors | 35,670 | 29,043 | 36,405 | 41,043 | 34,424 | 176,585 | ||||
| Turnout | 90.51% | 93.76% | 92.09% | 92.57% | 92.19% | 92.18% | ||||
The following candidates were elected:[32] Antoine Duquesne (PRL-FDF), 15,601 votes; Guy Larcier (PS), 11,508 votes; and Jean-Pol Poncelet (PSC), 25,522 votes.
Substitutions:[33]
- Antoine Duquesne (PRL-FDF) was appointed to the federal government and was substituted by Philippe Collard (PRL-FDF) on 14 July 1999.
1995[edit]
Results of the 1995 federal election held on 21 May 1995:[34][35]
| Party | Votes per arrondissement | Total Votes |
% | Seats | ||||||
|---|---|---|---|---|---|---|---|---|---|---|
| Arlon | Bast- ogne |
Marche -en- Famenne |
Neuf- château |
Virton | ||||||
| Christian Social Party | PSC | 8,434 | 8,795 | 9,189 | 11,274 | 7,704 | 45,396 | 32.26% | 1 | |
| Liberal Reformist Party and Democratic Front of Francophones |
PRL-FDF | 6,428 | 7,508 | 8,741 | 10,767 | 7,471 | 40,915 | 29.08% | 1 | |
| Socialist Party | PS | 8,816 | 3,593 | 6,553 | 7,198 | 7,710 | 33,870 | 24.07% | 1 | |
| Ecolo | Ecolo | 2,986 | 1,837 | 3,012 | 2,664 | 2,560 | 13,059 | 9.28% | 0 | |
| National Front | FN | 1,292 | 1,059 | 1,169 | 1,142 | 1,118 | 5,780 | 4.11% | 0 | |
| Unitarist and Centrist | UNIE | 192 | 91 | 111 | 277 | 520 | 1,191 | 0.85% | 0 | |
| Workers' Party of Belgium | PTB | 113 | 65 | 123 | 121 | 89 | 511 | 0.36% | 0 | |
| Valid Votes | 28,261 | 22,948 | 28,898 | 33,443 | 27,172 | 140,722 | 100.00% | 3 | ||
| Rejected Votes | 3,700 | 3,386 | 3,681 | 4,116 | 3,877 | 18,760 | 11.76% | |||
| Total Polled | 31,961 | 26,334 | 32,579 | 37,559 | 31,049 | 159,482 | 92.66% | |||
| Registered Electors | 34,913 | 28,039 | 35,099 | 40,393 | 33,670 | 172,114 | ||||
| Turnout | 91.54% | 93.92% | 92.82% | 92.98% | 92.22% | 92.66% | ||||
The following candidates were elected:[36] Antoine Duquesne (PRL-FDF), 17,515 votes; Guy Larcier (PS), 14,407 votes; and Jean-Pol Poncelet (PSC), 21,208 votes.
Substitutions:[37]
- Jean-Pol Poncelet (PSC) was appointed to the federal government and was substituted by Josy Arens (PSC) on 3 October 1995.
References[edit]
- ^ "Population by place of residence, nationality (Belgian/non-Belgian), marital status, age and gender". Brussels, Belgium: Statistics Belgium. Retrieved 30 May 2024.
- ^ "Land use according to the land register". Brussels, Belgium: Statistics Belgium. Retrieved 30 May 2024.
- ^ "DOC 55 0001/015 Liste des Membres de la Chambre et Leurs Suppléants" (in French). Brussels, Belgium: Chamber of Representatives. 24 October 2023. p. 13. Retrieved 13 June 2024.
- ^ "Election for Belgian Chamber of Representatives". Election Guide. Arlington, U.S.A.: International Foundation for Electoral Systems. Archived from the original on 15 August 2022. Retrieved 5 September 2022.
- ^ "Electoral Assistance: ElecData, Compendium of Electoral Data - Belgium". Strasbourg, France: Council of Europe. Archived from the original on 10 August 2022. Retrieved 5 September 2022.
- ^ "Belgium: Chambre des Représentants (House of Representatives)". PARLINE database on national parliaments. Geneva, Switzerland: Inter-Parliamentary Union. Archived from the original on 24 January 2022. Retrieved 5 September 2022.
- ^ "Informations générales: Dépouillement, répartition des sièges et désignation des élus - Chambre des représentants". Elections (in French). Brussels, Belgium: Federal Public Service Interior. Archived from the original on 24 September 2023. Retrieved 5 September 2022.
- ^ "Elections 2019: The 5% electoral threshold". VRT. Brussels, Belgium. 8 May 2019. Archived from the original on 13 August 2022. Retrieved 5 September 2022.
- ^ "Parliamentary information sheets: N° 09.00 The House of Representatives - Election" (PDF). Brussels, Belgium: Chamber of Representatives. 1 August 2019. p. 1. Archived from the original (PDF) on 27 December 2021. Retrieved 5 September 2022.
- ^ "Électeurs: Comment voter ?". Elections (in French). Brussels, Belgium: Federal Public Service Interior. Archived from the original on 10 June 2024. Retrieved 15 June 2024.
- ^ Wall, Alan (2 June 2021). "Open List Proportional Representation: The Good, the Bad and the Ugly". Stockholm, Sweden: International Institute for Democracy and Electoral Assistance. p. 15. Archived from the original on 6 April 2024. Retrieved 15 June 2024.
- ^ "Électeurs: Comment voter ? - Vote papier". Elections (in French). Brussels, Belgium: Federal Public Service Interior. Archived from the original on 21 May 2024. Retrieved 15 June 2024.
- ^ a b c "Informations générales: Dépouillement, répartition des sièges et désignation des élus". Elections (in French). Brussels, Belgium: Federal Public Service Interior. Archived from the original on 10 June 2024. Retrieved 15 June 2024.
- ^ "Résultats – Archives: Elections du 26 mai 2019 – Tableaux des résultats - Chambre - Nombres de votes obtenus par les listes répartis par canton". Elections (in French). Brussels, Belgium: Federal Public Service Interior. Archived from the original on 5 August 2019. Retrieved 18 August 2022.
- ^ "Résultats – Archives: Elections du 26 mai 2019 – Tableaux des résultats - Chambre - Nombres d'inscrits, de bulletins déposés, de bulletins valables, de bulletins blancs ou nuls par canton". Elections (in French). Brussels, Belgium: Federal Public Service Interior. Archived from the original on 5 August 2019. Retrieved 2 June 2024.
- ^ a b "Résultat Chambre des Représentants 26 mai 2019 - Circonscription de Luxembourg". Résultats électoraux (in French). Brussels, Belgium: Federal Public Service Interior. Retrieved 29 June 2024.
- ^ "DOC 55 0001/015 Liste des Membres de la Chambre et Leurs Suppléants" (PDF) (in French). Brussels, Belgium: Chamber of Representatives. 24 October 2023. p. 13. Retrieved 1 June 2024.
- ^ "Résultats – Archives: Elections du 25 mai 2014 – Tableaux des résultats - Chambre - Nombres de votes obtenus par les listes répartis par canton". Elections (in French). Brussels, Belgium: Federal Public Service Interior. Archived from the original on 6 June 2019. Retrieved 19 August 2022.
- ^ "Résultats – Archives: Elections du 25 mai 2014 – Tableaux des résultats - Chambre - Nombres d'inscrits, de bulletins déposés, de bulletins valables, de bulletins blancs ou nuls par canton". Elections (in French). Brussels, Belgium: Federal Public Service Interior. Archived from the original on 6 June 2019. Retrieved 2 June 2024.
- ^ a b "Résultat Chambre des Représentants 25 mai 2014 - Circonscription de Luxembourg". Résultats électoraux (in French). Brussels, Belgium: Federal Public Service Interior. Retrieved 29 June 2024.
- ^ "Résultats – Archives: Elections du 13 juin 2010 – Tableaux des résultats - Chambre - Nombres de votes obtenus par les listes répartis par circonscription et par canton". Elections (in French). Brussels, Belgium: Federal Public Service Interior. Archived from the original on 6 June 2019. Retrieved 19 August 2022.
- ^ "Résultats – Archives: Elections du 13 juin 2010 – Tableaux des résultats - Chambre - Nombres d'inscrits, de bulletins déposés, de bulletins valables, de bulletins blancs ou nuls par canton". Elections (in French). Brussels, Belgium: Federal Public Service Interior. Archived from the original on 6 June 2019. Retrieved 19 August 2022.
- ^ a b "Résultat Chambre des Représentants 13 juin 2010 - Circonscription de Luxembourg". Résultats électoraux (in French). Brussels, Belgium: Federal Public Service Interior. Retrieved 29 June 2024.
- ^ "DOC 53 0001/004 Liste des Membres de la Chambre et Leurs Suppléants" (PDF) (in French). Brussels, Belgium: Chamber of Representatives. 25 April 2014. p. 18. Retrieved 1 June 2024.
- ^ Elections Législatives du 10 juin 2007: Résultats officiels - Chambre des Représentants (PDF) (in French). Brussels, Belgium: Chamber of Representatives. pp. 18–19. Retrieved 30 May 2024.
- ^ a b "Résultat Chambre des Représentants 10 juin 2007 - Circonscription de Luxembourg". Résultats électoraux (in French). Brussels, Belgium: Federal Public Service Interior. Retrieved 29 June 2024.
- ^ Elections Législatives du 18 mai 2003: Résultats officiels - Chambre des Représentants (PDF) (in French). Brussels, Belgium: Chamber of Representatives. pp. 18–19. Retrieved 30 May 2024.
- ^ "Résultat Chambre des Représentants 18 mai 2003 - Luxembourg". Résultats électoraux (in French). Brussels, Belgium: Federal Public Service Interior. Retrieved 29 June 2024.
- ^ Elections Législatives du 18 mai 2003: Résultats officiels - Chambre des Représentants (PDF) (in French). Brussels, Belgium: Chamber of Representatives. pp. 253–272. Retrieved 30 May 2024.
- ^ Elections Législatives du 13 juin 1999: Résultats officiels - Chambre des Représentants (PDF) (in French). Brussels, Belgium: Chamber of Representatives. pp. 26–27. Retrieved 30 May 2024.
- ^ "Résultat Chambre des Représentants 13 juin 1999 - Arlon-Marche-en-Famenne-Bastogne-Neufchâteau-Virton". Résultats électoraux (in French). Brussels, Belgium: Federal Public Service Interior. Retrieved 29 June 2024.
- ^ Elections Législatives du 13 juin 1999: Résultats officiels - Chambre des Représentants (PDF) (in French). Brussels, Belgium: Chamber of Representatives. pp. 195–209. Retrieved 30 May 2024.
- ^ "DOC 50 0001/003 Liste des Membres de la Chambre et Leurs Suppléants" (PDF) (in French). Brussels, Belgium: Chamber of Representatives. 12 October 1999. pp. 16–17. Retrieved 1 June 2024.
- ^ Elections Législatives du 21 mai 1995: Résultats officiels - Chambre des Représentants (PDF) (in French). Brussels, Belgium: Chamber of Representatives. p. 24. Retrieved 30 May 2024.
- ^ "Résultat Chambre des Représentants 21 mai 1995 - Arlon-Marche-en-Famenne-Bastogne-Neufchâteau-Virton". Résultats électoraux (in French). Brussels, Belgium: Federal Public Service Interior. Retrieved 29 June 2024.
- ^ Elections Législatives du 21 mai 1995: Résultats officiels - Chambre des Représentants (PDF) (in French). Brussels, Belgium: Chamber of Representatives. pp. 197–204. Retrieved 30 May 2024.
- ^ "DOC 49 0001/001 Liste des Membres de la Chambre et Leurs Suppléants" (PDF) (in French). Brussels, Belgium: Chamber of Representatives. 3 October 1995. pp. 16–17. Retrieved 1 June 2024.